
Write-offs
The problem shows up after the loss
A failed compressor or a rising temperature gets noticed once the stock is spoiled, not when the deviation started.
One system for monitoring, metering and control across a network of plants, warehouses, pharmacies and stores. Temperature, energy, building systems and equipment in a single window, 24/7.
A pilot starts with 5-10 control points. Scaling to the whole network needs no change of equipment.
Deployments to date are largely in Ukraine.
In a large facility a problem is almost always noticed later than it began. The difference between seeing it at once and seeing it in the morning is a written-off batch, a stopped line, or an electricity bill nobody can explain.
A failed compressor or a rising temperature gets noticed once the stock is spoiled, not when the deviation started.
Equipment runs outside its schedule, overloaded, or at night. The bill shows it. The cause does not.
Temperature and humidity get checked irregularly, and entries get written in advance. Management is working from assumptions, not data.
That is when failures happen most often, and exactly when nobody is there to notice them.
Without a record you cannot prove when a deviation started, how long it lasted, or who should have responded.
Branches, warehouses and zones report in different places, or not at all. There is no single picture for the company.
Without monitoring, a business grows blind
One platform instead of three separate ones: sensors, meters and actuators share a network and a server.
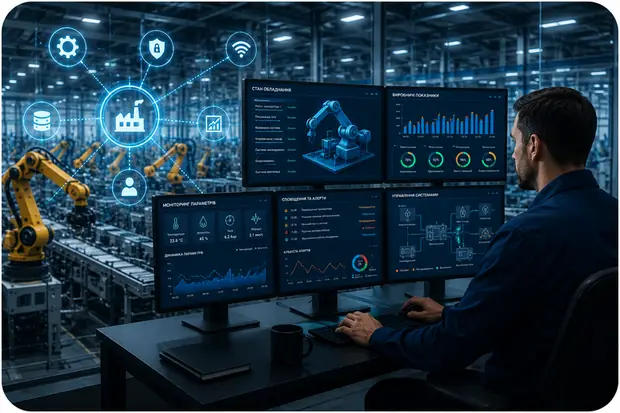
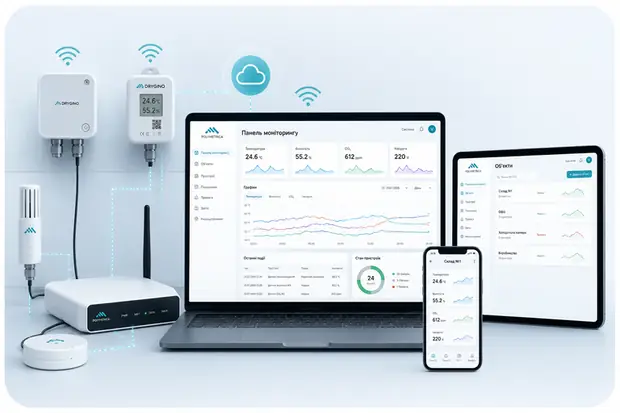
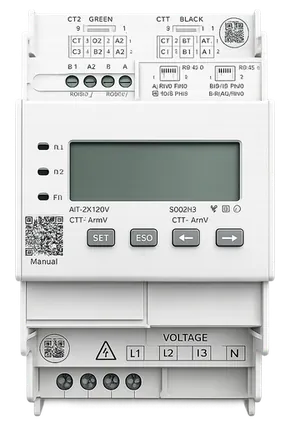
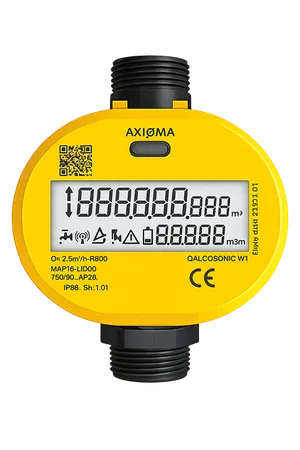
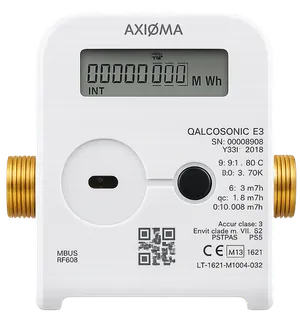
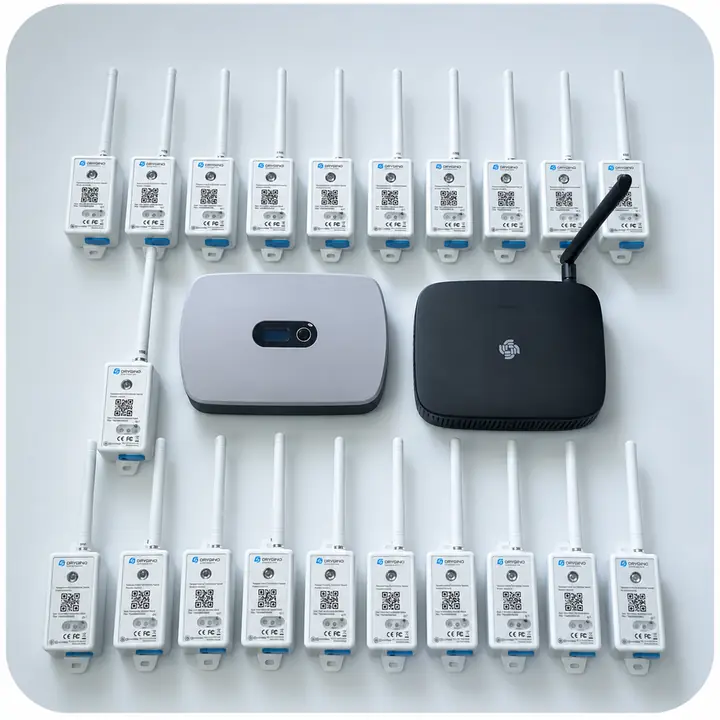
Sensors, meters and relays send data to the gateway over LoRaWAN, and the gateway forwards it to the server over 4G, Ethernet or Wi-Fi. No cable runs through the shop floor or the warehouse.
Installation takes a screwdriver and screws. The equipment arrives pre-configured: mount it, switch it on, and the data starts flowing.
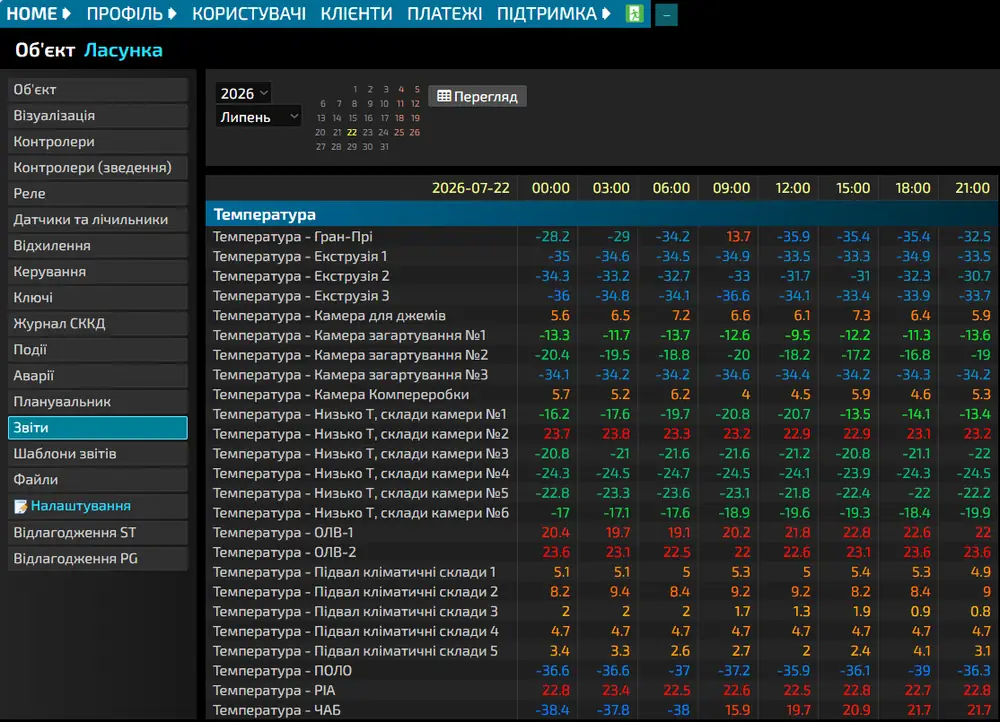
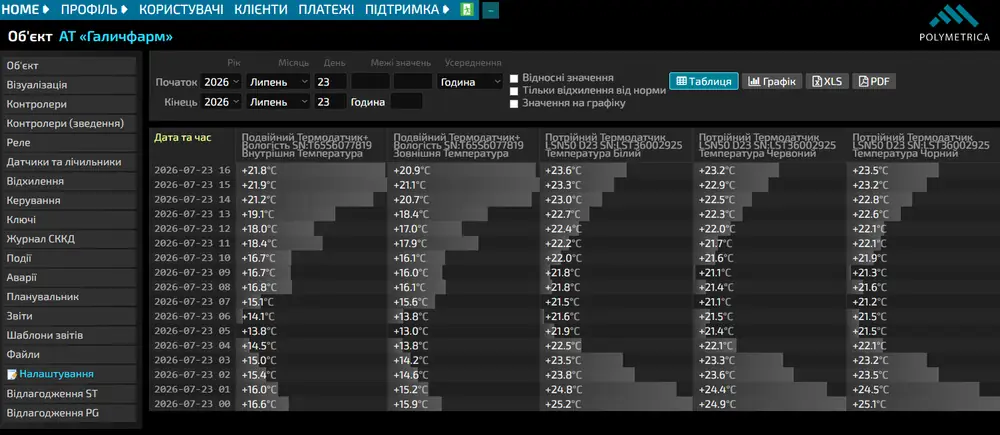
We draw the facility plan individually: zones, cold rooms, compressor rooms, meters and air curtains sit where they actually sit. Below are screens from live facilities.
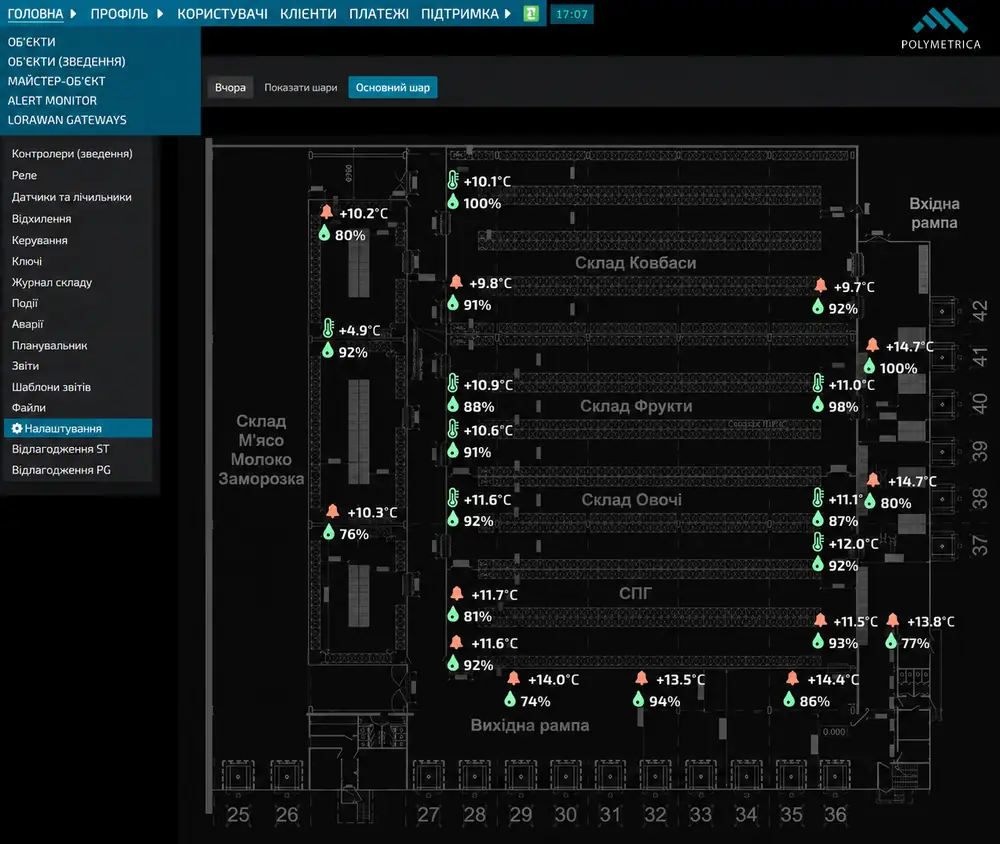
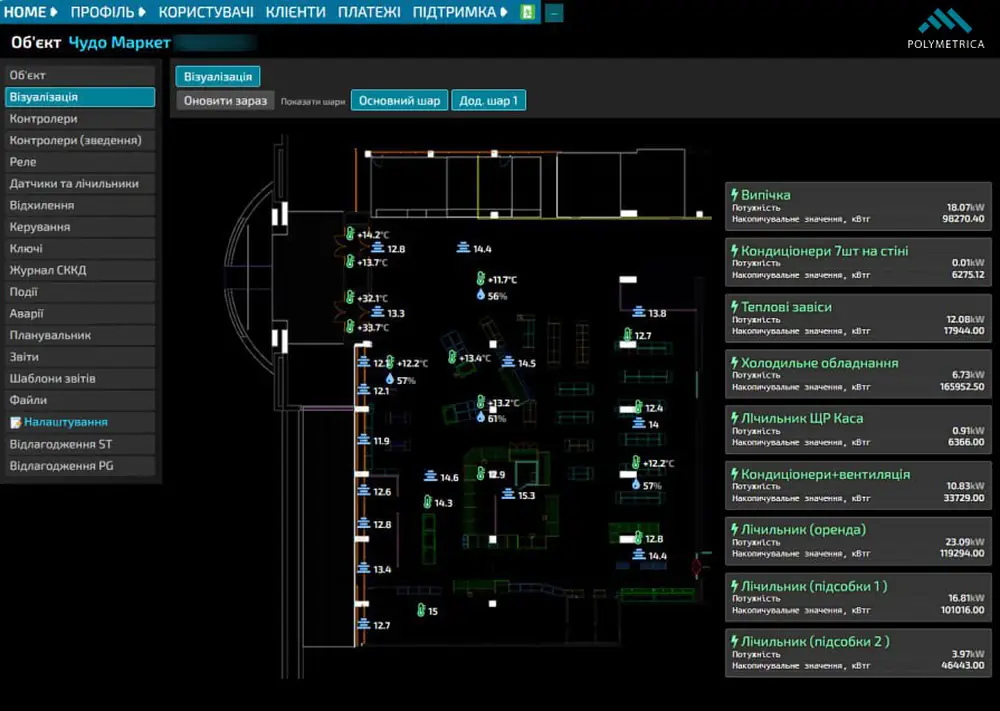
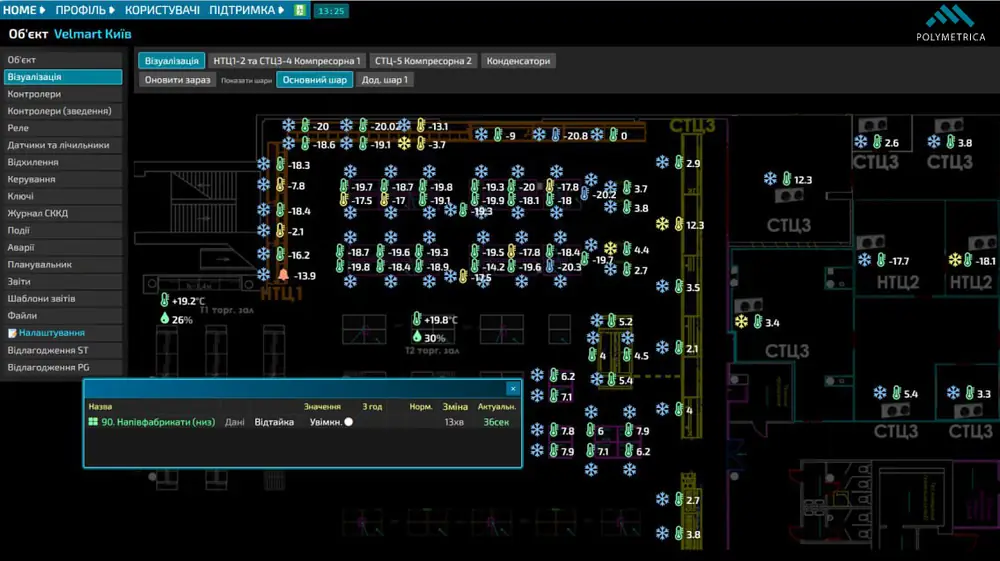
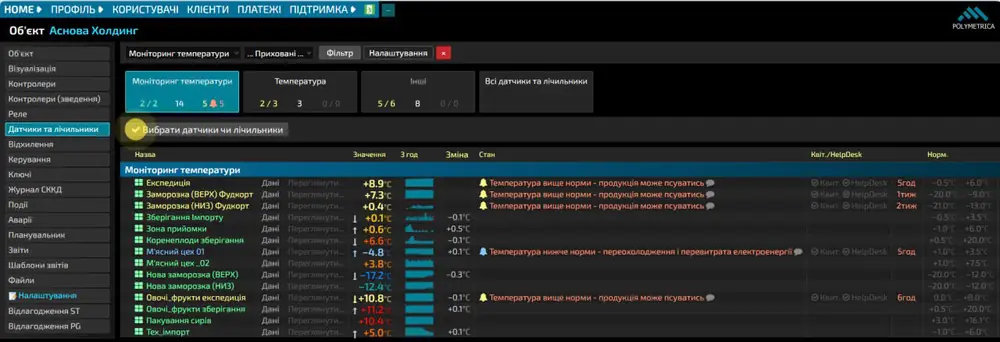
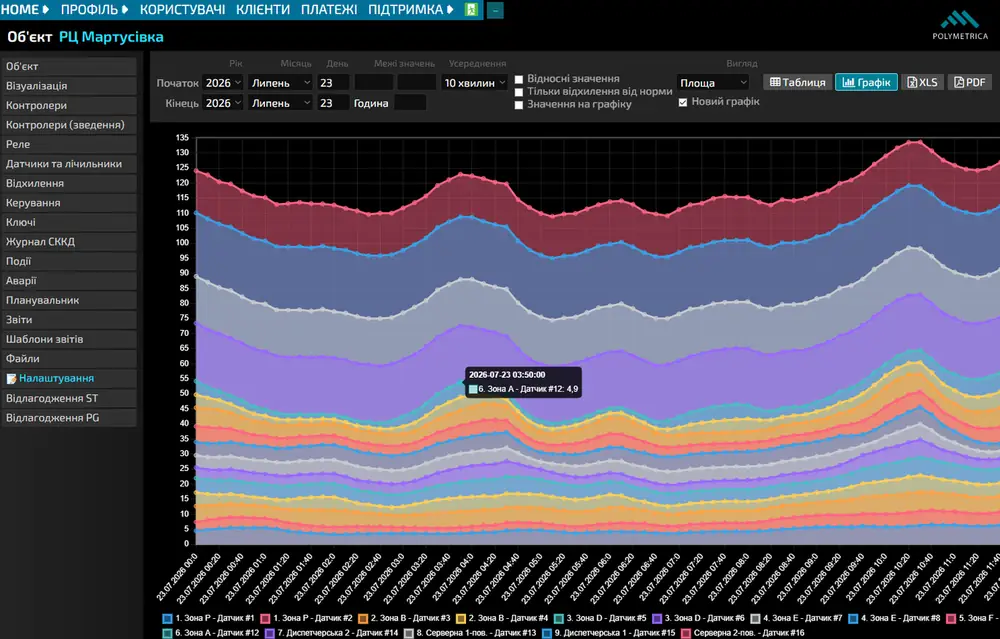
Screens from real facilities. Which readings appear, and how they are laid out, is configured around your processes.
The system keeps the full history, and produces charts, event logs and validation reports that show storage conditions met the requirements the whole time, not just at the moment of inspection.
| Control point | 00:00 | 06:00 | 12:00 | 18:00 | Range, °C |
|---|---|---|---|---|---|
| Freezer room 1 | -20.4 | -19.7 | -20.1 | -20.8 | -21 to -18 |
| Freezer room 2 | -22.8 | -23.1 | -22.4 | -22.9 | -24 to -20 |
| Blast freezer | -34.1 | -34.2 | -34.6 | -34.3 | -36 to -32 |
| Receiving area | +4.9 | +5.3 | +8.6 (above range) | +5.1 | 0 to +6 |
| Climate-controlled store | +18.2 | +18.0 | +18.6 | +18.4 | +15 to +25 |
| Dispatch area | +2.4 | +2.1 | +2.8 | +2.6 | 0 to +6 |
You cannot optimise what you do not measure. Metering by zone, by equipment and by tenant gives you a basis for decisions, and surfaces anomalies before they turn into failures.
You can see exactly where the energy goes, what it costs, and where equipment is running when it need not be.
Metering by zone and by equipment shows where the energy actually goes. That is what makes a saving findable, and provable afterwards.
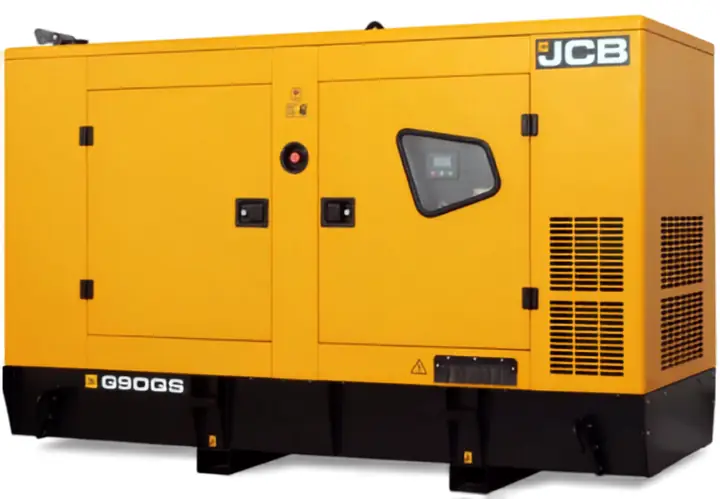
A separate loop for critical power: the generator has to start when it is needed.
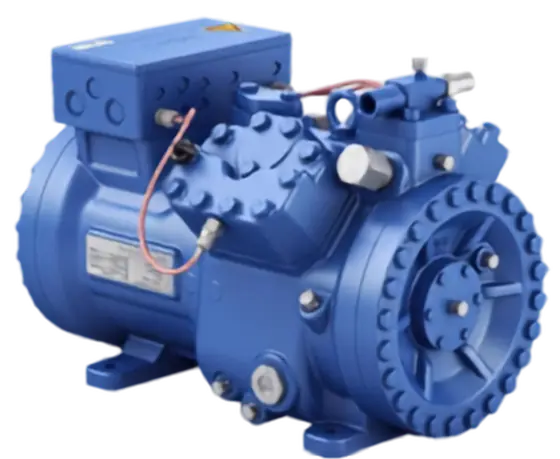
We connect to the controllers of refrigeration racks, compressors and other units and read their own parameters, not just the room temperature.
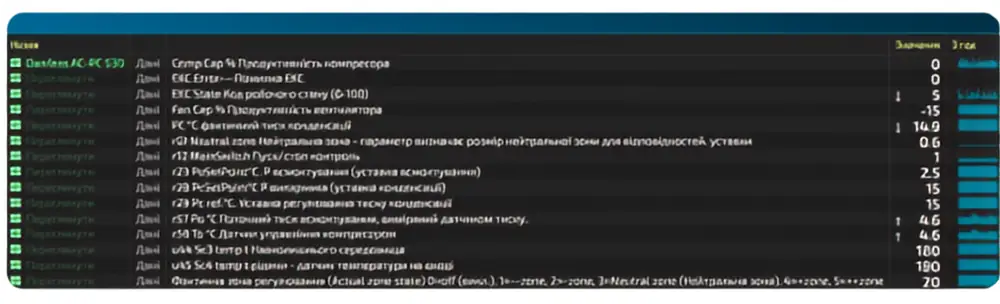
The order matters: first we prove the value at one facility, then we roll out the finished solution with no new approvals needed.
We work through what is already installed, which parameters are critical, and which losses are being measured today.
A gateway, sensors and meters on the riskiest zones. Real data instead of assumptions.
We draw the plan individually, with the equipment, zones and meters of your particular facility.
The same kit and the same interface on every facility, with one combined picture for the company.
Figures cover every deployment since the company started. Most of them are in Ukraine.
The 10 km usually quoted for LoRaWAN is open ground. Inside a steel-framed building with concrete floors it is a fraction of that, and how much depends on the structure, the racking and how full the building is. That is why we survey coverage against your layout instead of quoting a distance, and why the answer comes back as a number of gateways rather than a range.
The sensors and the gateway keep logging through it, and a backup power unit is part of the standard kit. The record continues across the outage, so there is no gap to account for afterwards.
A pilot on five to ten points takes a few hours per facility and goes in without stopping operations. The sensors are fixed in place rather than cabled in, so there are no wall penetrations to make and no shutdown to arrange.
Start with a review: we will show you which parameters at your facility are not monitored today and what that costs. Then a pilot on a handful of points.